EO HYDRO - Phase B (2005-2006)
EO-HYDRO is a project in the frame of the Earth Observation Market Development (EOMD) ESA programme. It aims at strengthening the European and Canadian industrial capacity to provide geo-information services based primarily on EO data. EO-HYDRO is thought to improve the hydro power plant management exploiting the newest EO technologies. The on-line service on European and Canadian countries is focused on water resource and security management. Snow cover, snow water content and land displacement are the main services provided by EO-Hydro.
|
Prime Contractor |
Carlo Gavazzi Space SpA |
|
Contract Number |
17735/03/I-I-IW |
|
Sub-Contract Number |
2034/03/06 |
|
Main Project Page |
|
Objectives
- setting up an integrated EO Based Service for hydropower plant management in close coordination and collaboration with the hydropower companies, in order to solve the major current blockages;
- performing pre-commercial trials over selected test areas;
- refining and improving the service in order to bring it to a marketable level;
- expanding the service, by bringing new partners and new services;
- promoting the service.
Realtime Runoff Forecasts of ENVEO
During the melting seasons 2005 and 2006 ENVEO provides daily 6-day runoff forecasts for several basins in the Zillertal, Austria.

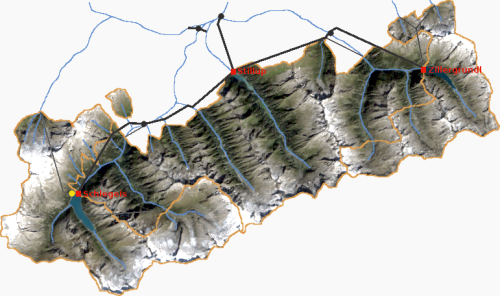
The Zillertal is located north of the main ridge of the Eastern Alps in Austria. In the southern part, the Zillertal is extensively used for hydro-power production. From 1950 to 1987 a network of hydropower stations and reservoirs operated by Verbund, was developed. The main reservoirs are Schlegeis and Zillergründl collecting the water from an area of 122 km2 and 66 km2 and a storage capacity of 126.5 106 m3 and 86.7 106 m3, respectively. Both basins are connected with the Stillupp reservoir with a storage capacity of 6.8 106 m3 and a drainage basin of 206 km2. Water from the Stillupp reservoir can be conveyed into Schlegeis and Zillergruendl. The Zemm-Ziller development has a mean annual power production of 1746 106 MWh. The Zillertal scenery is of high Alpine characterstic with rough and steep topography. Most of the underlying bedrock is granite and gneiss. The landcover is made up by cultivated meadows and a few agricultural fields in the valleys and coniferous forests up to the timberline at about 2200 m a.s.l. The runoff regime of the Zillertal basin is strongly influenced by its large glacier areas.
The Hydrological Modelling Platform (HMP) developed by ENVEO is the core package used for daily product generation. HMP includes tools for
- hydrological modelling / forecasting;
- automatic generation of geophyscial products from spaceborne optical and active microwave EO data (e.g. ENVISAT ASAR, ERS SAR, ENVISAT Meris, TERRA / AQUA MODIS);
- preprocessing of meteorological observation as well as numerical weather forecast (e.g. ECMWF, Aladin, DWD-Model) data and EO based products for use the hydrological models;
- database management of input data;
The actual version of HMP is dedicated for basins with substantial snow melt, but due to the modular structure of the system, HMP can be extented and adatpted for other basins in different environments and climates.
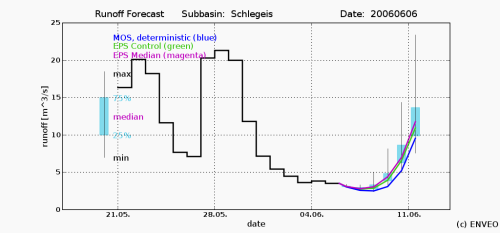
In the following a selection of the daily generated products is shown for the Schlegeis basin on 06 June 2006.

The above shown Ensemble Prediction System (EPS) runoff forecast plot depicts daily discharge for a basin versus time. It shows the observed data (black line) up to the previous day and the deterministic runoff forcast for the following 6 days (blue line). Additionally the min/max of 50 EPS runoff forecasts (turquoise candles) and 1 EPS control runoff forecast (green line) are shown. The spread within the 51 alternative scenarios assesses the uncertainty of forecast quantitatively. A combined use of deterministic and EPS forecasts allows to rate the most likely runoff development and give possible alternatives. The daily (deterministic) runoff and EPS runoff forecasts are based on precipitation/temperature forecasts of the ECMWF Determistic Atmospheric Model (T799) and 51 forecasts of the ECMWF Atmospheric Model (T399), respectively. Additionally temporally extrapolated satellite snow cover area information is used.

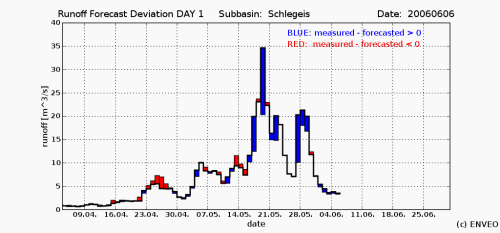
The Runoff Deviation Plot is a quality plot and depicts the deviations of the measured to the forecasted runoff versus time. An understimation of forcasted runoff is highlighted in blue, an overestimation in red.

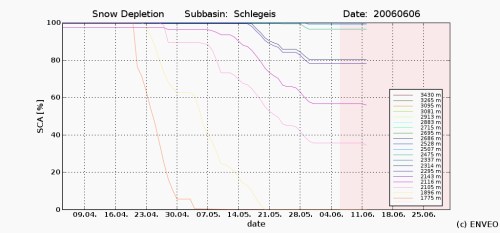
The Snow Cover Depletion Plot shows the interpolated snow cover as used within the model.

